
[ad_1]
PaulVinten/iStock via Getty Images
Amazon (NASDAQ:AMZN) has clearly broken through a lower low on the monthly time frame, with a probable third wave target of 1572.
If you read my previous article, you will know that one of the reasons I wrote the book The Ward Three Wave Theory was to try and provide accessible educational bearings for aspiring traders and entry-level finance professionals. In that article, I mentioned how I got the inspiration after having lunch during a day on the water, our captain proudly showing me an app on his phone where he was up 500 euros on a crypto trade he had placed. I didn’t delve too much into his knowledge of financial markets because, after looking at his phone, I noted that there was only a line graph and no bar chart on the app. I told him that I couldn’t gauge any future price predictions with him; his look of confusion about my technical name dropping led me to believe this was very much a “hit and hope” sort of situation.
I wanted to give tangible information that might appear complex, but is learnable to anyone willing to stick with it. It’s information that is clear on how to read waves on a financial chart. It’s information that can identify, with an arguably high overall level of probability, that the price on a chart will go from one point to another.
The truth is, this was not the first time I’d come across a situation like the one from lunch with that captain. A couple of years ago, I adopted a German Shepherd from a rescue center – a fascinating thoroughbred called Tarzan who had been there for over three years. Let’s just say Tarzan would be more suited to contributing to special forces operations than roaming my lawn.
Gradually, I became friendly with the lady who runs the rescue center and would stop by every once in a while with dog food. On one particular summer’s day I called and found her in the walking pen with a guy who’d wanted to volunteer there. We got to talking, as you do, and he said that he’d left the Royal Marines in the UK after a number of years and was looking to set up some boot camps, having had a number of meetings with various hotels. The chat progressed and he said, “I’ve put money into crypto and I’m up a bit.” Now, he could have been an analytic genius with a crystal ball in his backpack for all I know – to be honest, I just nodded and the conversation moved on.
It intrigued me: With no professional training, how can someone educate themselves to be able to identify that if they enter at one price area, there will be a high probability that the financial market they are trading will continue to another exact price area?
During my time learning about wave theory, I studied the Elliott Wave theory extensively. What I took from this was as follows: Where does any tangible certainty lie in entry and exit in this five-wave pattern? I concluded that the only “certainty” lay in wave three numerically replicating wave one, as wave one was the only printed bearing available. Any wave action after that displayed no actual printed evidence that an entry would lead to an exact probable numerical exit.
I have no issue with this famous wave theory that has undeniably stood the test of time. I gained a lot of educational grounding from the consistent tone of a prominent analyst who practices the theory. However, I do take issue with the fact that if you are going to follow it, its predictions might outline various scenarios of eventuality from any given chart reading.
Let’s now look at the chart for Amazon, and I will explain what my experience is telling me about exact price predictions. Normally, I like to write as the third wave is breaking the support or resistance of wave one and two, but I’ve only recently become a Seeking Alpha contributor, so the third wave we will be looking at is in its middle stage.
Amazon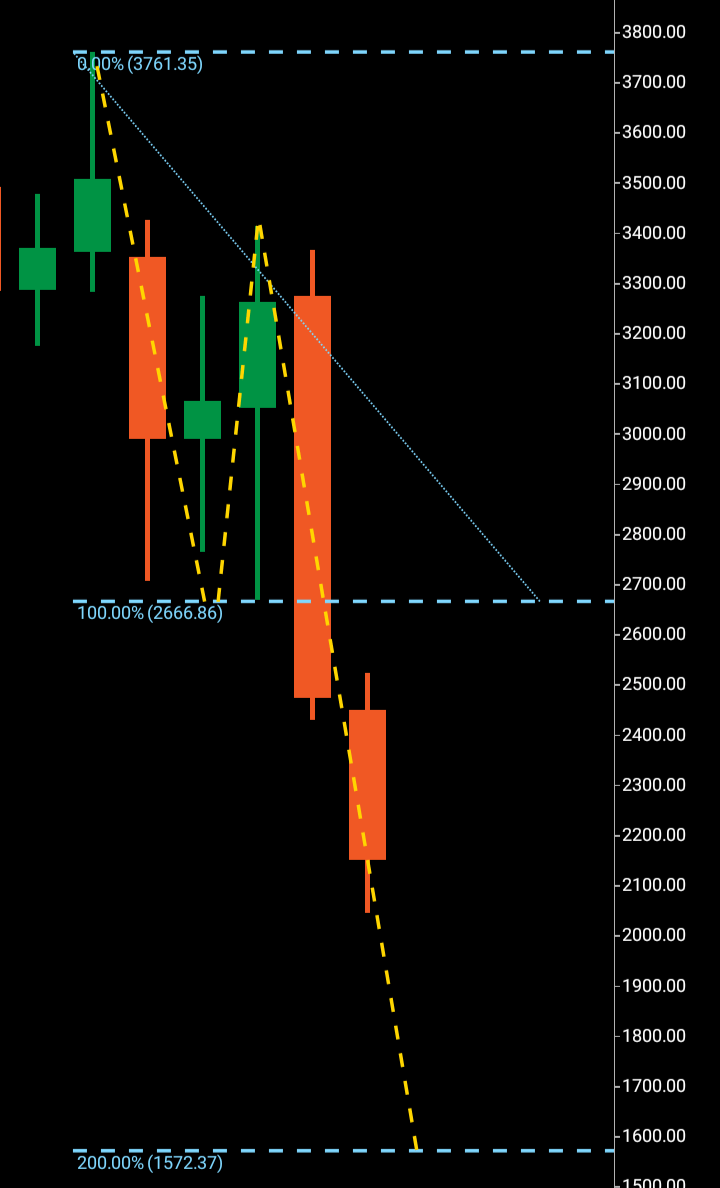
Source: Chart created by the author with data taken from cTrader.
Returning to the words “printed bearing,” we can see a clear high and low point of wave one 3700-2600 on this monthly chart. I want to reiterate that this is the only bearing we have for future price direction and numeracy. If a wave one is able to continue in a direction with sustained pressure before it finds its significant rejection, a wave two will retrace into the realms of that wave one to print the picture of a mismatch between buyers and sellers.
It is only when the wave three makes a higher high or lower low that we can confirm both of the preceding waves. If a wave one can go between two price points marking the point where the rejection was, then wave three will look to mirror that exact number before its significant rejection.
After the confirmation of wave two 2600-3400, Amazon has broken through its furthest point of rejection this month at 2600 – confirming the wave three. One can’t predict time frames of a future arrival at 1572, but we can clearly see the third wave in motion with the bearing of wave one making it arguably the most probable of exact targets, given the evidence in front of us.
That said, I would expect Amazon to complete its wave three and arrive at 1572 within the next 120 days. A break above 3700 before touching 1572 would be considered a wave fail. Looking at the weekly chart, it would not surprise me if the price headed toward support at 2600 before completing the third wave. It is entirely possible that Amazon could go lower if it reaches 1572; additionally, I will be looking for bullish reversal signs around that key area and plan to write article on how the price is reacting if this third wave arrives at its target.
[ad_2]
Read More: Amazon Stock: Riding A Wave To A Cheaper Berth Of $1572 (NASDAQ:AMZN)