
[ad_1]
Douglas Rissing/iStock via Getty Images
If over the past 13 years that I have been publishing it, this blog has contributed anything to our collective understanding of monetary policy, it is a focus on the balance between money supply and money demand. I’ve simply been following in the footsteps of the great Milton Friedman, who famously said that “Inflation is always and everywhere a monetary phenomenon, in the sense that it cannot occur without a more rapid increase in the quantity of money than in output.”
Curiously, this commonsense approach seems to have fallen by the wayside over the course of the past decade or so, probably because during that time the Fed engaged in unprecedented easing of monetary policy (aka “Quantitative Easing”) without there being a subsequent increase in inflation. Until this year, that is, when both the money supply and inflation surged. How to explain this? In my view, it’s all about supply and demand: the amount of money and the public’s willingness to hold it.
Friedman described how inflation works with a simple formula: M*V = P*Y, where M is money supply, V is the velocity of money, P is the price level, Y is a real gross domestic product, and P*Y is a nominal gross domestic product. That’s simple enough, but he also assumed (mistakenly) that the velocity of money was relatively constant, which led to his prediction that the inflation component of GDP would rise if M2 growth exceeded real output growth by some meaningful amount.
Rearranging and simplifying the first equation using the M2 version of the money supply (widely considered the best), we see that V = GDP/M2. In the past 3 decades, by this measure, the velocity of money has been anything but constant, and that apparently convinced many analysts that Friedman’s theory was seriously flawed. But was it?
Chart #1
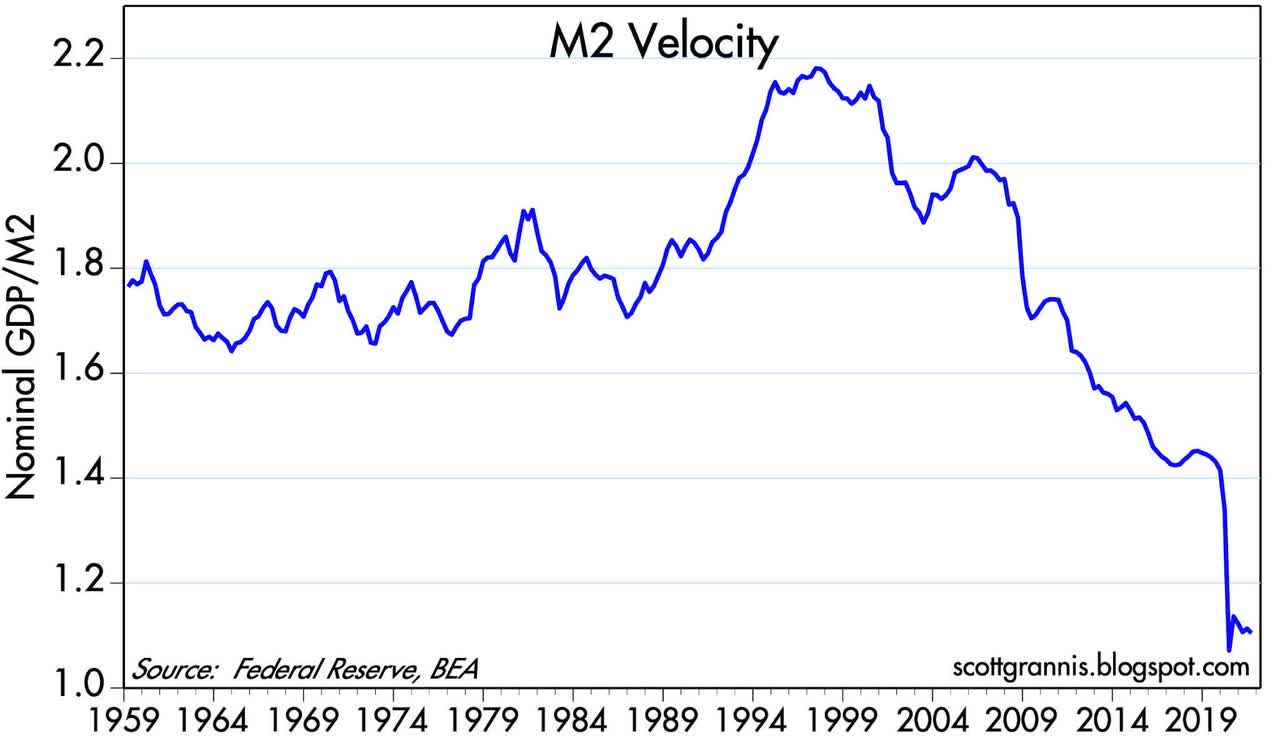
To be fair to Friedman, M2 velocity was fairly constant for a long time, as Chart #1 shows. From 1959 through the early 1990s, the velocity of M2 averaged about 1.75, which means that every dollar of M2 was spent on average about 1.75 times a year to support all the transactions that took place in the economy. That changed in the mid-1990s, however, as velocity soared and then proceeded to decline from 2001 through 2020. For most of the past 30 years, therefore, changes in the rate of growth of the money supply had little or no connection to the rate of inflation, which remained relatively low, around 2% or so. This led many observers to theorize that inflation was driven not by changes in the growth rate of money, but by other factors such as the rise of China, demographics, productivity, and/or government spending. Followers of Modern Monetary Theory went so far as to argue that the US government could borrow, print, and spend almost any amount of money without there being inflationary consequences.
My approach to making sense of all this began with realizing that the velocity of money (V) is simply the inverse of the demand for money: if you don’t want all the money you have, you have to speed up your spending; conversely, if you want to accumulate money, you have to slow down your spending. Going back to Friedman’s equation, I substitute D (money demand) for 1/V. This gives us D = M2/GDP. Since GDP is equivalent to national income, we can think of M2/GDP as a proxy for the amount of money (held in cash, money market funds, and various types of bank accounts) that the average person or entity wants to hold over time, expressed as a percentage of one’s annual income. So instead of thinking about how fast or how slow money turns over, I prefer to think in terms of how much money people are comfortable holding in relation to their income. That can and does change, especially during times of great uncertainty when people’s natural inclination is to accumulate money.
The Fed publishes the level of the M2 money supply once a month with about a 3-week lag. As of the end of November ’21, M2 was $21.4 trillion, having risen by about $5.9 trillion since the end of February 2020, just before the Covid crisis blossomed. So in the space of 21 months, the money supply increased by almost 38%. That’s by far the most rapid growth in M2 in history, and by an order of magnitude. (Milton Friedman must be turning over in his grave!) Yet many observers, the market, and the Fed itself are declaring that the burst of inflation we’ve seen this year is being driven not by all the money that has been created by the banking system (remember, only banks can create money, and they do that by increasing their lending), but by supply chain disruptions in the wake of the Covid crisis. So it’s just “transitory” inflation. (To be fair, the Fed of late has attempted to walk back its assertion that recent inflation is transitory, but they have yet to acknowledge that they have basically screwed up massively.)
Unfortunately, it’s not easy to prove that money, not supply chain disruptions, is the inflation culprit. But common sense says that a big increase in money that is not followed by a burst of inflation implies a big increase in the public’s demand for money. In the same vein, a big increase in money that is followed by a burst of inflation implies a weakening in the demand for money. Consider the price of apples. If there is an unexpectedly large harvest of apples, we would expect to see the price of apples decline. And if apples happened to be in short supply, their price would probably rise. Inflation is simply a decline in the value of the dollar, and it happens when the supply of dollars exceeds the public’s demand for dollars.
Since inflation failed to increase in the 2009-2020 period, we can infer with some confidence that the demand for money increased in line with the increase in the supply of money, and that velocity fell in inverse fashion to the increase in money supply. The same goes for the 4-5 months following the Covid crisis: money surged but inflation did not, so obviously money demand also surged. But since inflation this year has increased dramatically in the wake of the jump in money supply last year, then the demand for money over the past year must have either decreased or increased at a slower rate than the increase in money supply.
The easiest way to measure money demand is by looking at currency in circulation (which makes up about 10% of M2). Why? Because no one holds currency unless they want to hold it. If someone gave you a suitcase full of $100 bills, would you simply stash it under your bed or in your closet? Of course not. Well, unless you were a drug dealer or a mafia courier. Most people would trot off to the bank and deposit the cash in their account. The bank, in turn, would most likely decide it didn’t need to hold on to so much extra cash, so it would ship most or all of the money back to the Fed in exchange for bank reserves, which pay interest. Once in the custody of the Fed, those bills effectively cease to exist; they are no longer “in circulation.” So whatever the amount of dollar currency in circulation there happens to be, we can safely assume that it is money that people want—for transactions, for an emergency, or, as is the case with the trillions of US cash that are held overseas, as a store of value.
Now, let’s say that you wake up one day and discover that the world as you know it has suddenly changed: you no longer have a job, you can’t travel, you can’t go to restaurants, you can’t even see your family for Thanksgiving. But politicians have been compassionate enough to realize that you still need money to live, and so they start sending you unemployment insurance checks and monthly allowances for your kids. Business owners learn that they can borrow money that won’t need to be repaid as long as they don’t close up shop. Would it be surprising to learn that a lot of people would end up wanting to hold extra cash in their pockets and in their bank accounts?
Chart #2
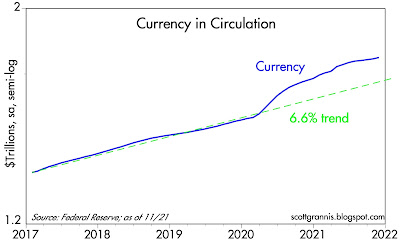
As Chart #2 shows, this is exactly what happened last year. After growing fairly steadily at 6-7% for decades, the amount of currency in circulation grew at an annualized rate of almost 23% from the end of February through the end of August ’20. But after that, the growth of currency decelerated. Over the next six months, currency rose at a 10% annualized rate. And in the past three months, currency has grown at a mere 4% annualized rate. Conclusion: by this measure, the demand for money surged last year but has since declined significantly—which means the velocity of currency has picked up. And not surprisingly, inflation has also picked up. This lends support to my thesis that the demand for M2 has also failed to match the increase in M2, and that is why inflation has surged.
Chart #3
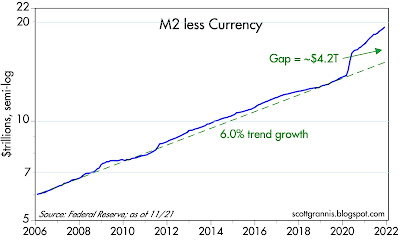
Chart #3 shows the level of M2 less currency in circulation. Here too we see a surge in growth initially (relative to its long-term trend growth rate of about 6% per year), followed by a moderation in the pace of growth. Since August ’20, however, the non-currency portion of M2 has been growing at about a 12-13% annualized rate; that’s down sharply from a 43% annualized rate in the six months ended August ’20 (the same period during which currency grew at a 23% annualized pace, as noted above). But it’s substantially higher than its long-term trend growth rate. At the very least, this looks like the source of our latest inflation surge. And it’s ongoing, which means there is very likely more inflation in our pipeline.
Let’s recap what we know about M2. The currency portion of M2 has exhibited a significant decline in its growth rate over the previous year or so. This strongly suggests that money demand has weakened. The non-currency portion of M2 has also exhibited a decline in its growth rate over this same period, but its growth rate remains historically elevated. If money demand has weakened but inflation has picked up, we must conclude that the increase in M2 has exceeded the public’s desire to hold M2, and inflation has been the inevitable result.
So what is driving the growth of non-currency M2? The banking system is uniquely able to create this component of M2: not the Fed, and not Treasury. When banks lend money they do so by crediting a borrower’s account with newly-minted “money.” The amount they lend is a function of 1) the demand for loans and 2) banks’ willingness and/or ability to lend. Given the ongoing rapid growth rate of M2, we know that the demand for loans is strong and banks these days are more willing to lend. Banks also face no constraints on their ability to lend, since the banking system has over $4 trillion in excess reserves (i.e., $4 trillion more in reserves than they need to support their current level of deposits).
This leads to a very important point. Increased borrowing on the part of the public—and the additional money this creates—is best thought of as declining money demand, because when you borrow money you are “short” money, since you benefit if the value of the money…
[ad_2]
Read More: The Fed Is Ignoring The Demand For Money